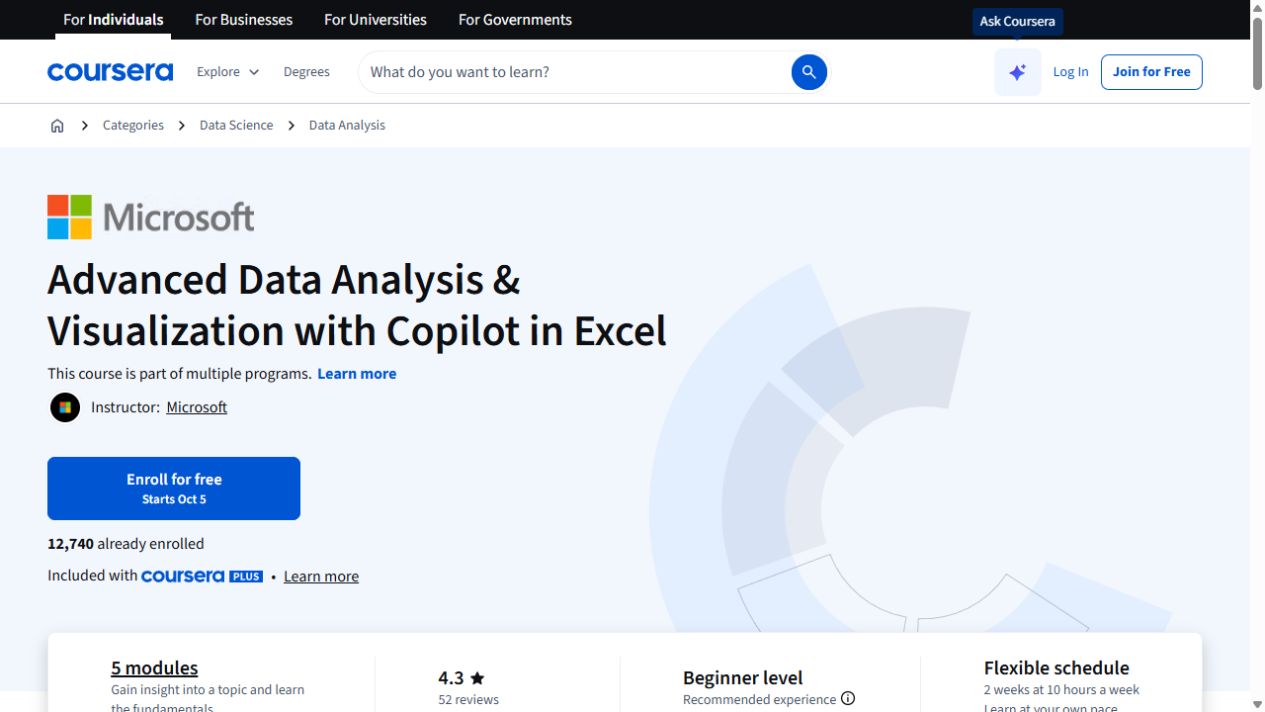
What you’ll learn
- Statistical analysis
- External-data organization
- Pivot visualizations
- Charts for communication
- Reporting findings
What does the learning look like?
- 22 assignments are listed across the five modules.
Example to try
Make sense of a spreadsheet
- 01Start with
A small table of expenses
- 02Make a first pass
Clean data + a useful formula
- 03Make it yours
Check row counts and totals
Use a fictional example to practise the workflow.
Cost, access and setup
Course cost
- Check the course page for certificate pricing, free trials and options to study without a certificate.
- Listed as included in Coursera Plus. Check your subscription for access.
What you’ll need
- The course explicitly requires a Copilot license
- It advertises a linked 30-day trial for learners without Microsoft 365 Personal or Family.
How you’ll learn
- 2 weeks at 10 hours a week
- Self-paced with flexible scheduling listed.
Certificate
- Course-completion certificate listed
Instructor
- Microsoft
Keep exploring
Compare Copilot courses for Excel
This guide is for people who want to use Copilot inside Excel. Check which spreadsheet jobs the course covers and whether your Microsoft account can run them.…
Find your starting pointGet spreadsheet data ready for AI
Before using AI to analyze a spreadsheet, check whether the data is complete and consistent. Cleaning is different from interpreting results. Preserve the…
Find your starting point